Case studies
Real campaigns. Real numbers.
A closer look at the Google Ads results from accounts we manage and the websites we have built: what drove them and what you can take from them.
$10M+
Revenue generated for our clients
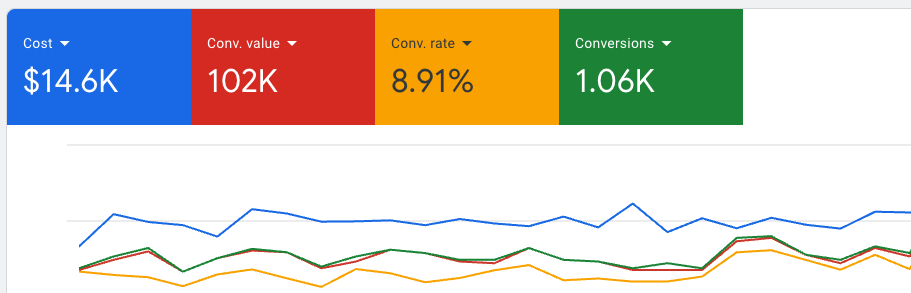
7.0x
Return on ad spend, e-commerce campaign
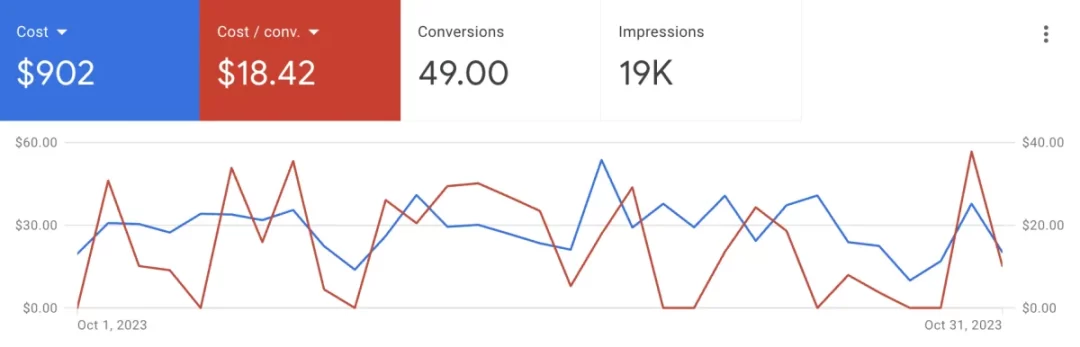
$18.42
Cost per conversion, lead generation campaign
Google Ads
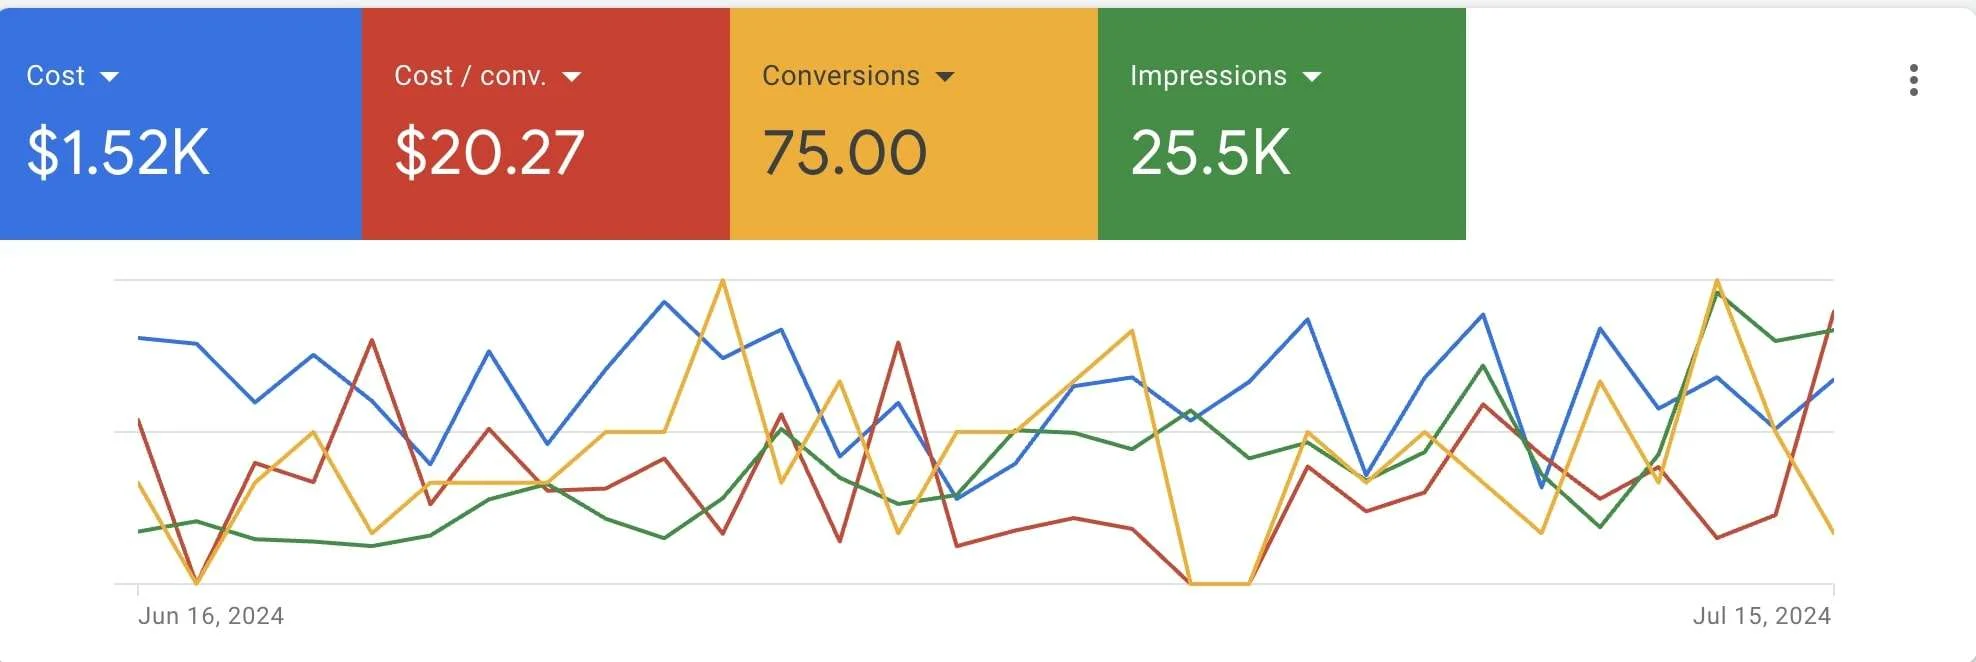
Results from the accounts we manage.
Each case study breaks down the numbers straight from the Google Ads account.
Websites
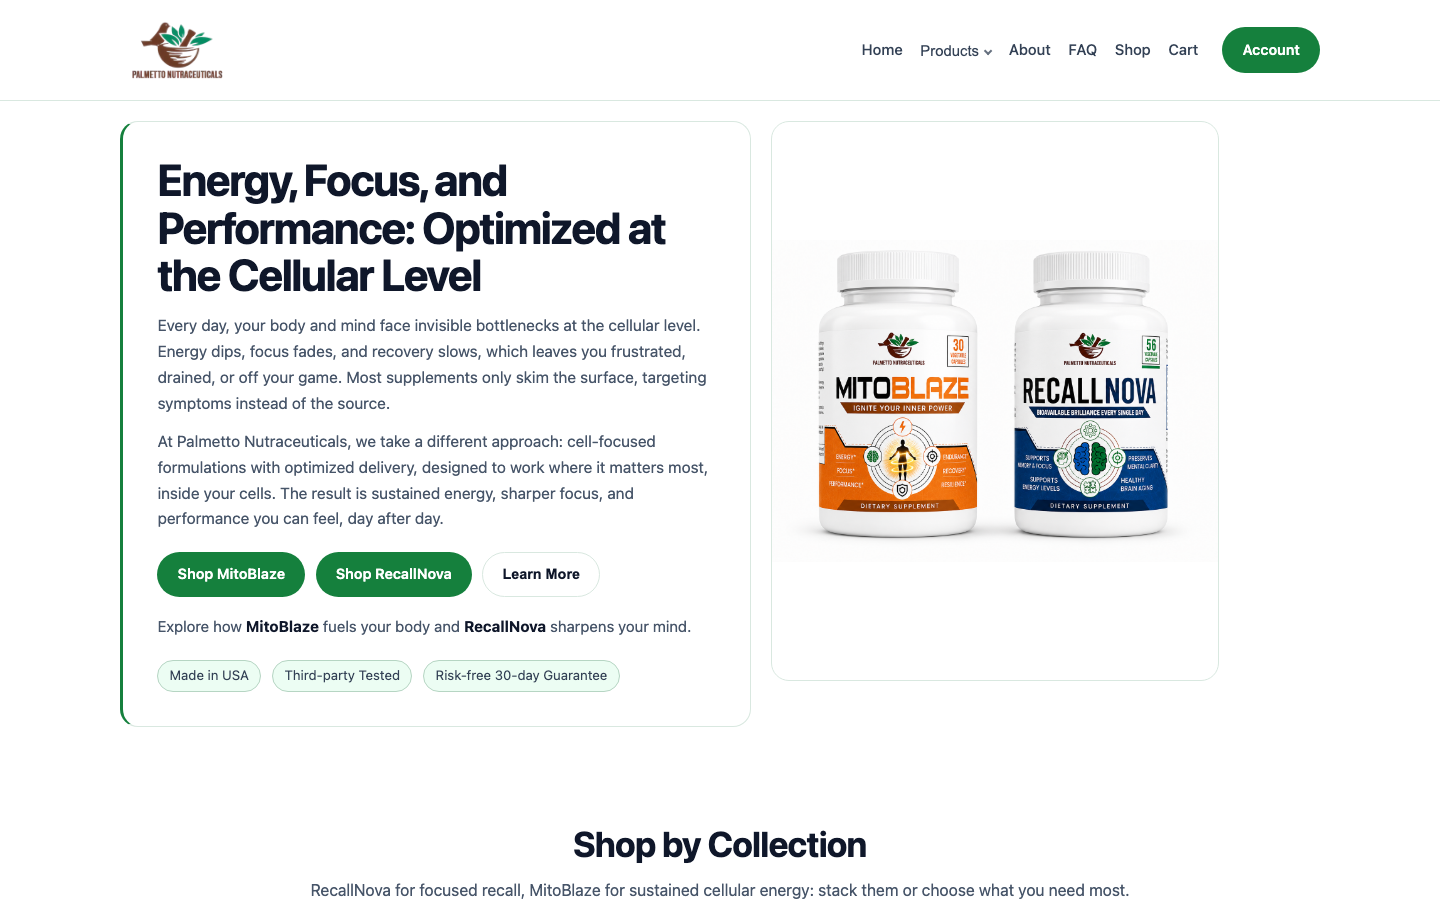
Websites we've built.
Live sites, designed and developed from scratch.

How to read the numbers
Four terms, plain English.
Everything in these case studies comes down to these four metrics.
Return on ad spend (ROAS)
Conversion value divided by ad spend. A 7.0x ROAS means about $7 in tracked conversion value for every $1 spent.
Conversion
A tracked action that matters to the business, such as a purchase, a phone call, or a form fill.
Cost per conversion
Ad spend divided by the number of conversions. It tells you what each lead or sale costs to acquire.
Conversion rate
The share of ad interactions that result in a conversion. Higher usually means better-matched traffic.
Figures come from the Google Ads accounts we manage, and client names are kept confidential. Results depend on the business, market, offer, and budget, and are not a guarantee of future performance.
Your turn
Want numbers like these?
Tell us about your business and we will show you what Google Ads could look like for you. Free consultation, no obligation, no contracts.